Articles published since 2000| 2001| 2002| 2003| 2004| 2005| 2006| 2007| 2008| 2009| 2010| 2011| 2012
Under CAPM, the market portfolio is the portfolio on the efficient frontier with the highest Sharpe ratio. The slope of the capital market line equals the market (i.e. index) Sharpe ratio.
The Sharpe ratio makes implicit assumptions which stem from the capital asset pricing model (CAPM) (Treynor, 1962; Sharpe, 1964; Lintner, 1965; Mossin, 1966): it assumes either 1) normally distributed returns or 2) mean-variance preferences. Both assumptions are suspect:
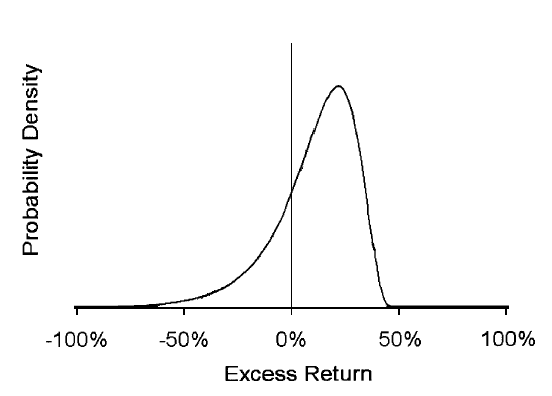
Because the Sharpe ratio is oblivious of all moments higher than the variance, it is prone to manipulation by strategies that can change the shape of the probability distribution of returns. Mathematically, maximizing the Sharpe ratio is a standard quadratic programming optimization problem with the constraint that the mean excess return is fixed. Goetzmann, et al. (2002) proved that the solution produces a reversed lognormal distribution with a truncated right tail and a fat left tail leading to extreme negative skewness, as shown below. The optimal strategy involves selling out-of-the-money calls (to remove the right tail of the distribution) and selling out-of-the-money puts (to enhance the left tail) in an uneven ratio. Such a strategy would generate a regular return from writing options, but would have a large exposure to extreme negative events. In other words, a manager with no special information can improve his Sharpe ratio in such a way that the distribution of returns exhibits negative skewness. As mentioned above, most investors prefer positive skewness, therefore, although a high Sharpe ratio is good thing, a high Sharpe ratio strategy is a bad thing.
SHARPE, William F., 1994. The Sharpe Ratio. The Journal Of Portfolio Management, 21(1), 49–58.